

Methodology
Methodology Report for www.travelandclimate.org
Version 5.0
Jörgen Larsson, docent and researcher at Chalmers University of Technology, has had the main responsibility for the numerical data and for this Methodology.
Jörgen Larsson, associate professor, Chalmers University of Technology
Fredrik Warberg, project manager, Travel & Climate
Erik Nylund, IT developer, Travel & Climate
Table of Contents
2 General assumptions and system boundaries
2.1 Life Cycle Emissions from Fuels and Vehicle Production
2.2 Climate footprint from electricity
2.3 Climate footprint from biofuels
3 Transport mode – calculations of emissions
3.5.1 Transfer to/from airport
3.5.2 Train + flight combination
3.5.3 Climate impact from fuel production and from the non-CO2 effects
3.5.4 Comparison of emissions calculators
4 Accommodation – calculations of emissions
5.1 Consequences and comparisons of holiday emissions
1 Background and introduction
Tourism is one of the fastest growing industries in the world. From having once been an activity for the rich and privileged, tourism and travel today are part of the everyday lives of the growing middle class in the world. Since the start of mass tourism in the 1960s, the number of tourists has doubled many times over. This rise in tourism has brought economic growth and positive social and cultural exchanges, but a number of sustainability challenges from tourism have also been highlighted in the media and by researchers: polluted seas, deforestation and soil erosion, littering, prostitution, displacement of local populations, and greenhouse gas emissions (Mowforth & Munt, 2015). The last challenge, in particular, has attracted increasing focus. The tourism industry is dependent on (air) travel. Flights account for 60-95% of the climate footprint of tourism, and growth in tourism goes hand in hand with more flights (Gössling et al., 2005). In 2017, air travel by Swedish residents had almost the same climate impact as all passenger vehicle traffic in Sweden (Kamb et al., 2018). The symbiotic relationship between air travel and tourism has created a clear goal conflict as destinations are investing more and more in trying to attract international tourists while there is simultaneous pressure on them to reduce their climate footprint.
The background to this report is the Travel and Climate initiative (in Swedish, Klimatsmart semester). Its aim is to help make tourism more sustainable by developing a digital platform with tools and knowledge content that can help people to holiday with a smaller climate footprint. It also aims to assist the tourism industry’s sustainability efforts. The initiative receives, or has received, funding from the West Sweden Tourist Board, Region Västra Götaland, the City of Gothenburg, the Centre for Tourism at the University of Gothenburg, Chalmers University of Technology, Mistra Sustainable Consumption, and the Swedish Energy Agency.
As part of this initiative, a web-based tool for calculating the climate footprint of holiday trips has been developed: www.klimatsmartsemester.se and www.travelandclimate.org. It was originally launched in 2019 and is being gradually developed in order to constantly be up-to-date with the latest statistics and scientific analyses. The trip calculator is unique in its kind as it calculates the environmental impact of different modes of transport (e.g., air/train/ferry/bus/different types of cars) and a range of accommodation choices. The calculations are based on scientifically produced data, including from our own previous studies, and on life-cycle analyses carried out by other researchers and organisations. The digital platform also provides tips on low carbon travel to inspire users to make more sustainable choices.
Travel & climate is operated as a collaboration between Chalmers University of Technology (Jörgen Larsson) and the Centre for Tourism at the University of Gothenburg (Erik Lundberg). Chalmers Next Labs is the administrative party for Travel and Climate/Klimatsmart semester. Jörgen Larsson, senior researcher at Chalmers, is primarily responsible for all data and for the methodological report that has been produced, a work in which Anneli Kamb, a doctoral student at KTH participated in for previous versions. Erik Lundberg, Center for Tourism at the University of Gothenburg, has been the project manager, Fredrik Warberg, Tidsverkstaden, has acted as project manager and Erik Nylund, Cosmovalent is the project's IT developer.
2 General assumptions and system boundaries
In order to calculate the climate footprint from different options, we have had to make many assumptions and choices with regard to system boundaries. The general assumptions that affect many the different modes of transport/accommodation choices are described below. Assumptions that only relate to one mode of transport/accommodation choice are described in their respective sections in the relevant chapter 3.
2.1 Life Cycle Emissions from Fuels and Vehicle Production
Common to all modes of transport is that the calculations cover emissions from the fuel throughout its entire life cycle, i.e., emissions during extraction/production[1], distribution, and combustion. For this, data from the Swedish Energy Agency's annual report on the climate impact of fuels (Energimyndigheten, 2026) is used.
Another part of the transports' climate impact is the emissions that occur during the production of vehicles. For passenger cars, these emissions are included, see section 3.1, while this is not the case for other modes of transport (train, plane, bus, ferry). However, this is not considered to significantly affect the comparison between the modes of transport. The reason is that emissions from the production of trains, airplanes, buses, and ferries become very low, calculated per passenger kilometre, because they transport a very large number of people throughout these vehicles' lifetimes. Other analyses have also made the assessment that this is negligible (Morfeldt et al., 2023). Rahn et al. (2022) estimate the emissions from the production of an airplane to be 0.2 percent of the airplane's total life cycle emissions. For cars, however, the production emissions become relatively large as they are driven much shorter distances over their lifetimes. The emissions that occur during the construction of infrastructure (roads, airports, rails, ports) are not included for any of the modes of transport.
2.2 Climate footprint from electricity
Electricity is used for trains, electric cars and in accommodation, and we describe in this section how the calculations were made for the emissions caused by electricity based on where it is consumed.
Some companies buy green or eco-labelled electricity (e.g. some railway companies) and based on that they report very low emissions. However, we do not deem this to be reasonable, since paying extra for this does not have any effect on emissions in the real world. This view is also described in a report from the IVL Swedish Environmental Research Institute (Gode et al., 2009, p 8) where they argue that the same mix of electricity sources will in fact be used, regardless of whether the customer made this choice or not. It is said that there is no additionality linked to the customer’s active choices. This means that the purchase of renewable electricity does not entail any short-term real improvements in the environment, nor does it have any direct impact on the development of the electricity system. One reason for this is that the supply of hydropower in the Nordic energy market is much greater than the demand for green electricity. Another reason is that decisions on investments in new wind power, for example, are primarily influenced by trends in production costs and what the current policy instruments are.
Emissions from the electricity consumed are instead based on the average emissions for the Nordic electricity market as a whole. These emissions are calculated according to a report by IVL Swedish Environmental Research Institute (IVL, 2025), at 59 gCO2e/kWh. This figure refers to average emissions from electricity consumed in the Nordic electricity market during 2021–2023, taking into account imports and exports of electricity from and to neighbouring countries. Emissions from electricity consumption in the rest of Europe, for 2026, are estimated at 278 g CO2e/kWh (Morfeldt et al., 2023). These figures refer to an average for emissions from different energy types within each geographical area and also include upstream emissions as well as transmission losses.
2.3 Climate footprint from biofuels
There has been controversy for some time over the climate footprint that should be attributed to the use of biofuels, which is evident from the breadth of articles published in scientific journals and in the Swedish and international media, as well as in policy positions within the EU. One position is that biofuels have a very low climate impact and that they are a key part of the solution to the climate issue. The Swedish Energy Agency’s annual report on fuels reflects this position (Energimyndigheten, 2023).
Another position is that a global switch to biofuels is neither possible nor desirable, and this position emphasises the potential threat to biodiversity and the questionable climate benefits. Analyses that include changes in land use have shown that crop-based biofuels can even have a greater impact on the climate than fossil fuels (Searchinger et al., 2018).
The climate impact of biofuels is affected not only by the choice of system boundaries (e.g., whether changes in land use are included or not) but also by the feedstocks used in the fuels analysed, such as whether they constitute residue flows or cultivated crops. The Swedish Energy agency (Energimyndigheten, 2026) reports the raw materials used for the biofuel utilized in Sweden. For HVO, primarily residual flows are used (slaughterhouse waste constitutes 53% of the raw material). The HVO blended into diesel to meet the reduction obligation has not contained any palm oil/PFAD since 2019. For the production of ethanol, maize, wheat and sugar beet are mainly used. These figures refer to 2024 and change from year to year.
In the trip calculator on the Travel and Climate initiative website, we use figures from the Swedish Energy Agency’s annual report on greenhouse gas emissions from different fuels, and these form the basis for calculating emissions from cars and buses (Energimyndigheten, 2026). For biofuels the CO2 emissions from the exhaust pipe are counted as zero and the emissions that are taken into account are those that occur in the production and distribution of the fuels. According to the Swedish Energy Agency, the climate impact is 46% lower for E85 than for standard petrol, and 82% lower for HVO100 compared to standard diesel.
The emissions from vehicle gas/biogas are in this version 5% lower than previous versions. The reason for this is that the Swedish Energy Agency has changed the calculation method for the climate effect of biogas produced from manure in agriculture, and now the methodology is based on the EU renewable directive. Previously, these calculated emissions were low, but now they are even assumed to be negative because the production of biogas leads to the avoidance of methane emissions from manure handling.
3 Transport mode – calculations of emissions
![]()
In the holiday trip calculator, you can choose between several different modes of transport. By default, four options are presented for the user to choose from train/bus, diesel car, and air travel (see Figure 1). On certain routes, there is also the option of train + flight, where a train journey is combined with a flight.
The figures show what the emissions would be from each mode of transport to the chosen destination. These emissions are based on the default options for each transport mode. You can also make your own choices of e.g. a specific size of the car or a specific type of fuel. It is also possible to add sub-legs to the search in order to split the journey into stages with different modes of transport, vehicles or fuels.
Figure 1 The different modes of transport in the holiday trip calculator.
Table 1 below shows the emission factors that ww.travelandclimate.org is based on. Bolded emission figures are the standard choices that the results are based on if one does not actively choose, for example, another type of fuel. Car emissions per person in Table 1 are divided by 3, which is the average number of people in each car on trips over 300 kilometers (source: own calculations based on the national travel habit survey 2011-2016, RVU1116 (Trafikanalys, 2017). Emissions from cars also include emissions from the production of the vehicle. While table 1 are emission factors per person-kilometer, table 2 shows the missions per vehicle-kilometer (i.e. for a car regardless of how many people that travels with it).
Table 1 Emission factors. Gram CO2e/person-kilometer
|
Per person-kilometer (based on 3 persons in the car) |
|||||
|
Small car |
Medium sized car |
Large car |
Camper/caravan |
||
|
Car |
Diesel |
56 |
74 |
97 |
144 |
|
Gasoline |
46 |
60 |
79 |
117 |
|
|
Electricity Nordic a) |
13 |
18 |
23 |
34 |
|
|
Electricity Europe a) |
24 |
32 |
42 |
63 |
|
|
Fossil gas |
45 |
60 |
79 |
117 |
|
|
Vehicle gas b) |
6 |
8 |
10 |
15 |
|
|
Biogas c) d) |
6 |
8 |
10 |
15 |
|
|
Ethanol |
25 |
33 |
44 |
65 |
|
|
Biofuel HVO100 d) |
14 |
19 |
25 |
37 |
|
|
Per person-kilometer |
|||||
|
Economy |
Economy premium |
Business Class |
|||
|
Flight |
Standard fuel |
Scheduled |
117 |
143 |
263 |
|
Charter |
108 |
131 |
- |
||
|
100% biofuel d) |
Scheduled |
21 |
26 |
47 |
|
|
Charter |
19 |
23 |
- |
||
|
Train |
Electricity Nordic a) |
4 |
|||
|
Electricity Europe a) |
19 |
||||
|
Diesel |
96 |
||||
|
Biofuel HVO100 d) |
17 |
||||
|
Bus |
Diesel |
32 |
|||
|
Biofuel HVO100 d) |
6 |
||||
|
Biofuel FAME100 d) |
8 |
||||
|
Passenger |
1 car (without passenger) |
||||
|
Ferry |
Standard fuel |
186 |
377 |
||
a) For calculation of emissions from electricity use, see section 2.2.
b) Mix of 98% biogas and 2% fossil gas, average for vehicle gas in Sweden 2024 (Energimyndigheten, 2026).
c) For calculation of emissions from emissions from biofuels, see section 2.3.
d) According to the Swedish Energy Agency's new calculation method, biogas produced from manure is credited with a greenhouse gas bonus due to negative emissions (as a result of avoiding methane from manure handling).
Table 2 Emission factors for cars. Gram CO2e/vehicle-kilometer
|
Small car |
Medium sized car |
Large car |
Camper /caravan |
||
|
Car |
Diesel |
168 |
221 |
292 |
433 |
|
Gasoline |
137 |
180 |
237 |
352 |
|
|
Electricity Nordic a) |
40 |
53 |
70 |
103 |
|
|
Electricity Europe a) |
73 |
97 |
127 |
189 |
|
|
Fossil gas b) |
136 |
180 |
237 |
351 |
|
|
Vehicle gas c) |
17 |
23 |
30 |
45 |
|
|
Biogas d) e) |
17 |
23 |
30 |
44 |
|
|
Ethanol d) |
76 |
100 |
132 |
196 |
|
|
Biofuel HVO100 d) |
43 |
57 |
75 |
112 |
3.1 Car
The emissions per passenger km when you drive a car vary greatly depending on the size of the car, the fuel used and the number of people in the car. The bar for cars displays the emissions from a mid-sized diesel car as the default choice. By hovering over the car stack, one can change the fuel type and car size. The user can also fill in the number of people on the trip, which is then used to calculate the emissions per passenger km.
To be able to present emissions calculations that reflect as accurately as possible the holiday trip the user is planning, we have developed emission factors for a range of fuel and car size combinations (see table 1 and 2 above). The emissions calculations use data from the Swedish Energy Agency report (2026)which updates well-to-wheel figures for all fuels annually. The figures include emissions from the extraction, production and distribution of the fuels.
The emission calculations differ between small, medium-sized, and large cars. An increase of 34% has been made for large cars compared to medium-sized cars[2]. Small cars are almost always petrol cars. These are assumed to use an average of 24% less energy than medium-sized petrol cars. Campers/caravans are assumed to use 96% more fuel than a medium-sized car (Hammarström, 1999).
The emission factors in Table 2 are used in the holiday trip calculator, and these are divided by the number of persons entered for the planned trip. In cases where the number of persons exceeds five, it is assumed that the group will travel in more than one car. The number of cars is calculated by dividing the number of people by five and rounding up, i.e., if the group is six to ten people, they are assumed to be travelling in two cars, 11 to 15 people are assumed to be travelling in three cars, etc. If the user chooses a 7-seater car, the same method is used, but the calculation is based on seven people per car instead.
The emissions from gasoline and diesel cars take into account the lower blending of biofuel, i.e., the greenhouse gas reduction mandate, which is 10% for both gasoline and diesel since July 2025. During 2022 and 2023 it was 30.5% for diesel and 7.8% for petrol. During jan 2024 to July 2025 it was 6% for both. The emissions at fuelling in many other countries are equivalent to the current Swedish level, for example, Germany has a reduction obligation of 9.3%, while France has about 9.5%.
In addition to emissions from fuels, the emissions that occur during the production of the cars, i.e., the climate impact that the car causes before its delivery to the buyer, are also included. Different figures for this have been calculated for battery electric cars and for cars powered by combustion engines. The emissions are distributed over the expected number of kilometers driven during the car's entire lifespan. The emissions per vehicle kilometer are calculated to be 22 grams of CO2 for cars with combustion engines, and 41 grams for battery electric cars[3]. The total climate impact is 221 grams of CO2 for a medium sized diesel car, and 53 grams for battery electric cars when driven in the Nordic countries, with production emissions constituting 10% for combustion engine cars and 78% for electric cars. There have been claims that electric cars do not provide any climate benefit when production emissions are taken into account (often based on old data), but according to these calculations, the emissions from electric cars are about a quarter of those from diesel cars.
The figures are intended to reflect the emissions associated with the production of a new car that is put into operation in 2024. The reason for not using older estimates is that emissions from battery production have historically been very high and thus do not reflect modern battery production. In cases where electric cars are used for vacation travel, they are likely also relatively new cars since long range electric vehicle is preferable. Some also rent electric cars for vacation needs, and rental cars are normally relatively new.
3.2 Train
Trains that run on electricity in Sweden and the rest of Europe generate considerably lower emissions than diesel trains. All of 80% of rail travel (pkm) in Europe is by electric train (IEA, 2019, p 50) and therefore this is the default choice in the holiday trip calculator. For travel in Sweden/Norway/Finland, the emission factor for trains is 4 grams CO2 equivalents per passenger km (abbreviated throughout as g CO2e/pkm). The corresponding figure for the rest of Europe (including Denmark) is 19 g CO2e/pkm. The calculation is based on an energy consumption of 70 Wh/pkm[4]. The fact that emissions are higher for electric trains in Europe compared to Sweden is related to how the electricity is produced (see Section 2.2). We do not take into account that some companies in Sweden and other countries use eco-labelled electricity (see Section 2.2.)
However, there are quite a number of diesel trains and if you know that a leg of your trip involves travel by diesel train, this type of train can be selected in the trip calculator. For diesel trains, an emission factor of 96 g CO2e/pkm is used (Knörr & Hüttermann, 2016). There are country-level statistics on the share of train travel (not the share of pkm) by diesel train: Sweden 4%, Finland 8% Norway 36%[5], Denmark 58%, France 23%, Austria 32% and Italy 52% (Eurostat, 2017). For the rest of the world, it may be relevant to mention that the Trans-Siberian railway is electrified[6]. Non-electrified railway lines are mostly used for local trains (Bundesnetzagentur, 2019).
For journeys that include a leg by train in Sweden/Norway/Finland as well as the rest of Europe, train legs that have either their origin or destination in the Nordic countries are counted as being by Electric train (Nordic countries), while other train legs are counted as being by Electric train (Europe) in the calculator.
For trips with diesel trains using 100% biodiesel (HVO), the emission difference compared to standard diesel is calculated based on the fuel data for road traffic provided by the Swedish Energy Agency (where HVO100 has 82% lower emissions than standard diesel with a greenhouse gas reduction mandate of 10%) (Energimyndigheten, 2026).
For combination trips with train and flight, see section 3.5.2.
3.3 Bus
The emissions per pkm for bus legs of a trip depend mainly on the occupancy rate of the bus and the fuel used. The default choice in the emissions calculator is that the bus runs on a blend of fossil and bio-based diesel in accordance with the greenhouse gas reduction mandate , which from July 2025 requires emissions to be 10% lower than for 100% fossil diesel(Energimyndigheten, 2026). The emissions calculation is based on the assumption that the average number of bus passengers is 25, and with an average fuel consumption of 26 litres per 100 km (Sveriges Bussföretag, 2022). This translates into emissions of 29 gCO2e/pkm.[7] In countries with no or lower biofuel blend-in mandates this emission factor is an underestimation. If you know that you will be travelling on a bus running on 100% biodiesel (HVO100 or FAME100) then you can choose this in the calculator. The emission factor for HVO100 is estimated at 5.5 gCO2/pkm and for FAME/RME100 to 8 gCO2/pkm (see Section 2.3).
3.4 Ferry
As with the other modes of transport, emissions per pkm may vary depending on many factors. One important factor is the speed of the ferry. High-speed ferries (used for some trips to Gotland, for example) use twice as much energy per pkm as conventional ferries (Åkerman et al., 2007). However, these high-speed ferries account for a small proportion of the total volume of ferry traffic in Swedish waters, therefore our calculations refer to normal-speed ferries.
When calculating the emissions from ferry traffic, you need to choose a principle for allocating the total emissions between the two main types of services sold by ferry companies: transport of passengers and transport of goods (freight). Unfortunately, different ferry companies have chosen to use different principles, making it difficult to compare them
The principle that we use, which we find to be the most accurate, is financial allocation. Here, emissions are divided between passengers and freight based on their share of the ferry company’s income from passengers and freight. The logic behind this is that it is the revenue of the ferry companies that drives their ongoing operations and that it is therefore reasonable that the proportions from their revenue are used to distribute the emissions. For example, if 70% of their revenue comes from passengers and 30% from freight, 70% of the emissions are allocated to passengers and 30% to freight.
As far as we know, financial allocation has not been applied in the past for Swedish ferry companies. We have therefore collaborated with Viking Line and Stena Line and calculated the emissions per person-kilometer for them based on economic allocation[8] (the difference between these ferry companies was about 35%). To account for the emissions from extraction, refining, and transportation of fuels, 20% has been added to these emissions.
The distribution of calculated emissions between passengers and personal cars is also based on economic allocation. Here, a simplified calculation has been made where prices have been obtained for journeys with and without a car[9]. The additional cost of taking a car corresponded on average to the price for two passengers without a car. Based on this, emissions per passenger without a car, and per car, have been calculated.
Another possible allocation principle is the area method, where emissions are allocated between passengers and freight based on the space they take up on the ferry. This method is used in the Swedish Environmental Protection Agency’s tool for measuring the climate footprint of travel (Wisell & Jivén, 2020)[10]. It reports average emissions for 7 different ferry lines (not high-speed ferries) as 274 gCO2/pkm[11]. Other estimates of emissions from ferries (which also use the area method) have been somewhat lower than in the Swedish Environmental Protection Agency’s tool for measuring the climate footprint of travel[12] (Lenner, 1993; Åkerman, 2012). Gotlandsbolaget (a ferry company) instead uses the weight method for allocating emissions between passengers and freight. This allocation method results in comparatively very low emissions: 40 gCO2/pkm (excluding high-speed ferries)[13].
Some ships are powered by LNG, which is a liquefied fossil gas. The direct emissions from these ships are normally lower than for comparable diesel-powered ships (Iannaccone et al., 2020), but regarding the total emissions including extraction, refining, transport, and leakage, there are estimates that suggest both higher and lower total greenhouse gas impact (Bengtsson et al., 2011; Iannaccone et al., 2020).
3.5 Air travel
As with other modes of transport, the emissions of a flight depend on a number of factors. Emissions per pkm vary depending on the aircraft model, distance, flight altitude, number of seats in the aircraft and the occupancy rate, for example. We have taken some of these into account in the calculator by allowing the user to make a number of choices.
The default option is for a Scheduled flight (Economy) with emissions of approximately 117 gCO2e/pkm (for 2026). This figure is based on direct emissions of 83 gCO2/pkm for all flights globally in 2026. This figure is from an unpublished update of Kamb et al. (2018). The update was made with data for 2024, assuming a 1.5% annual reduction thereafter (Cho et al., 2019). Gössling et al. (2026) report a figure approximately 3% lower, which can likely be explained by their calculation being based on actual flight distance rather than great-circle distance. The figure of 83 grams is an average for all seat classes; for economy class, the figure is lower (see below).
To account for emissions from extraction, production and distribution of fossil aviation fuel, a markup of 20% is applied beyond the emissions from combustion (Jing et al., 2022). In addition, the climate impact from the so-called high-altitude effects is added with a multiplication factor of 1.5 (see section 3.5.1).
For flights where no direct connection is available, a supplement is applied to include the additional distance that arises when the journey goes via an intermediate hub airport. The supplement is 6 percent, based on an analysis of travel in the EU by Paleari et al. (2010).
Finally, it is assumed that 2% of aviation fuel is renewable, in accordance with the EU blending requirement for 2025–2029. There is also an option to voluntarily pay extra for a higher share of biofuel. and choosing 100% biofuel is a selectable option in the calculator. For biofuel, the climate impact from production and combustion is estimated to be 80% lower than for fossil fuel (ICAO, 2025; Kurzawska-Pietrowicz, 2023), and the high-altitude factor is also lower (see section 3.5.1). These climate performances apply to the renewable fuels most commonly used today, where production is based on waste streams, primarily frying oil and fats from slaughterhouse residues.
The calculation is based on the assumption that 2% consists of bio-based fuels. The calculations are based on emission data from the Swedish Energy Agency (Energimyndigheten, 2026)which suggest that emissions from biojet are just over 90% lower than for fossil fuel. These good climate performances are based on the fuel being produced from waste/residual flows, half from used frying oil and half from fat in slaughterhouse residues (more about biofuel can be found in section 2.3). In addition, flights with bio-based fuel also cause so-called high-altitude effects.
In the trip calculator, the user can choose between several different options. To start with, they can choose different types of flights. Charter companies typically have higher occupancy rates than airlines for scheduled flights, resulting in lower emissions. This is why the Charter option is available. Based on figures from two large charter companies, emissions for 2026 are calculated at 108 gCO2epkm. Emissions from economy class in charter are therefore approximately 8% lower than economy class in scheduled flights[14] (Thomas Cook Airlines, 2019; TUI GROUP, 2017).
So-called turboprop airplanes are propeller aircraft that have the advantage of not causing any high-altitude effects because they do not fly at sufficiently high altitudes. There are indications that turboprop may be somewhat more fuel efficient than jet airplanes, but the data availability for this is limited. We have therefore chosen not to include turboprop as a selectable option in the climate calculator.
In addition, emissions per pkm are significantly affected by the seat class chosen by the passenger (Miyoshi & Mason, 2009). Since premium economy and business class seats take up more floor space in an aircraft, fewer passengers can be carried on each flight. Therefore, premium economy and business class passengers should account for a larger share of emissions per passenger. In a review of ten standard airlines, we calculated that an average business seat takes up 2.2 times more space than an economy seat, and a premium economy seat takes up 1.2 times more space[15]. If we also take into account the distribution between the number of passengers in each class (Bofinger & Strand, 2013), we can adjust the emissions of each seat class compared to those of the average passenger, as shown in Table 3.
|
Economy |
Premium economy |
Business |
|
|
Scheduled |
0.84 a) |
1.0 |
1.9 |
|
Charter |
0.97 |
1.2 |
- |
a) Default choice in the calculator.
We use Google Maps to determine the coordinates of the departure point and the destination, and based on that identify which airports are nearby. Data regarding distance and flight route, including layovers, is obtained from Carbon Compute. Emissions for the trip are then calculated by multiplying the distance by the selected emission factor (for full equation see previous version of this this report).
3.5.1 Transfer to/from airport
The emissions for flights include transfers on the ground, i.e., the journey to the departure airport and from the arrival airport to the final destination. The distance to the airport is calculated based on the distance between the departure point (place of residence) and the nearest airport. Transfers from the arrival airport to the final destination are calculated in the same way. A standard figure of 95 gCO2 per person-km is used, based on data from the Swedish Transport Analysis agency (Trafikanalys, 2017) showing that 80% of journeys to the airport are made by car and 20% by bus or train. The standard figure assumes an average of 2 persons travelling in a medium-sized diesel car. It is also possible to choose a differnt car type or bus in the calculator.
3.5.2 Train + flight combination
Sometimes the calculator shows a bar for the combination of train + flight. This means the calculator has found a travel route where a combination of public transport and flight results in significantly lower emissions than a pure flight. The calculator examines the possibility of shortening the flight by replacing part of the journey with a train, either before or after the flight leg. For this option to be shown, four conditions must be met:
· There must be a direct flight for the relevant flight leg.
· The train journey before or after the flight is less than 800 km.
· Public transport connections to or from the flight has fewer than 6 transfers.
· The total emission reduction for the proposed combination is at least 20 percent.
The calculator thus identifies cases where a combination of train and air travel results in at least 20% lower emissions than flying the entire route. The starting point is a list of direct flight routes where the air-plus-rail combination has strong potential to meet that criterion. For each search, the system checks whether any airport on the list is located within 600 km one way of the departure or destination location. If so, it also checks whether public transport is available to that airport. If both conditions are met, and the total emissions are at least 20% lower than for the direct flight, the alternative is shown in the calculator. The list is reviewed and updated on an ongoing basis.
3.5.3 Climate impact from fuel production and from the non-CO2 effects
Since our flight’s emissions occur at high altitudes, there are climatic effects in addition to CO2 to take into account, such as the contrails formed when warm, moisture-rich aircraft exhaust gases encounter the ambient cold air at high altitudes and form ice crystals (Azar & Johansson, 2012; Lee et al., 2021)[16]. Under certain conditions, the contrails from a flight can persist for several hours; under other conditions they disappear within a few minutes. Only the persistent ones are important to consider in terms of climate impact. In addition, the emissions of the flight can increase the formation of high cirrus clouds, mainly as a result of persistent contrails developing into cirrus clouds. In addition, there are other warming effects in the form of emissions of nitrogen oxides (NOX), for example. We can simply call all of these ‘non-CO2 effects’.
There is uncertainty surrounding how great these non-CO2 effects are, and the scientific understanding is different for each of the different mechanisms involved in non-CO2 effects. The most commonly used multiplication factor in recent years is that, measured with GWP100, the aggregate climate effect is approximately 1.7 times higher than the effect of CO2 alone(Boucher et al., 2013; Lee et al., 2021). However, more recent reviews suggest the figure should be revised downward (EASA, 2026; Johansson et al., 2025) and based on this we use the multiplication factor 1.5. Research also indicates that high-altitude effects are lower for biofuels (Sustainable Aviation Fuels) than for fossil fuels (Boerboom et al., 2025; Märkl et al., 2024), and we therefore use a multiplication factor of 1.3 for biofuels.
In a number of flight calculators, the Radiative Forcing Index (RFI) is used to take these non-CO2 effects into account; usually the IPCC estimate for 1992 is used with an RFI of 2.7 (IPCC, 1999). The problem with the RFI is that it reflects current climate impacts from historical emissions rather than future climate impacts from current emissions, which is what we are interested in. Because of this, the use of RFI for aviation is, according to Fuglestvedt et al. (2010), wrong. They believe that Global Warming Potential (GWP) is a better index as it measures the future climate impact of current emissions.
The non-CO2 effects of a specific flight vary greatly depending on the length of the flight, the season, the weather conditions, and time of day for example, and can be both higher and lower than the markup of 1.5 that we have used. However, it can be said with certainty (Miljöförbundet Jordens Vänner, 1997) that for shorter flights it is on average lower, because the aircraft does not reach a sufficiently high altitude, or spends only a small proportion of the flight time there. This means that a markup of 1.5 is an overestimation for short flights (Fichter et al., 2005). Analogously, CO2 emissions should have a higher markup for the longest flights for the global average to end up at 1.5.
What is also particular for air travel, compared to other modes of transport, is that the take-off (the start of the trip) is more energy-intensive than flying at a constant altitude. As a result, emissions of CO2 per pkm are typically higher for short flights, because the take-off represents a larger proportion of its total emissions. Thus, since emissions of CO2 per pkm typically decrease with distance, and the effects of non-CO2 emissions increase with distance, these two effects largely cancel each other out.
Non-CO2 effects come primarily from jet planes when they fly at the altitudes where these effects arise most frequently. Propeller (turboprop) planes typically do not fly at high enough altitudes to cause high altitude effects, as they are primarily used for distances below 500 km (Amizadeh et al., 2016). However, these short flights are likely to cause higher CO2 emissions than the global average, as their energy-intensive take-offs increase their average fuel consumption for shorter distances.
3.5.4 Comparison of emissions calculators
In order to assess the outcome of the model used in www.travelandclimate.org we have compared it to the carbon emissions calculator used by the International Civil Aviation Organization (ICAO)[17]. To compare the calculators, only carbon emissions during combustion are included; thus, we have excluded the climate footprint of fuel production and air travel's non-CO2 effects, since the ICAO does not include these in its calculator.
The comparison was presented in its entirety in version 2.0 of this methodology report, see here. To sum up, our model results in essentially the same levels of estimated emissions as the average obtained from the ICAO carbon emissions calculator. If the ICAO were to include the climate impact of fuel production and the non-CO2 effects of flights, their average emissions would be roughly the same as the figures used in www.travelandclimate.org.[18] However, emissions from the ICAO calculator vary considerably between routes, which is probably due, among other things, to the types of aircraft used and the distance of each route.
4 Accommodation – calculations of emissions
The impact of climate change per guest night (one overnight stay in accommodation by one person) depends on a variety of factors. It is easy to think that a large luxury hotel will always have a greater climate footprint and that a smaller establishment providing less fancy accommodation automatically has a smaller climate footprint. But that is not necessarily the case. While it is likely that accommodation with more surface area uses more energy per guest night, how the premises are heated, and the type of energy used often plays an even greater role for its climate footprint. For example, a more luxurious hotel can have a small climate footprint if they heat their establishment with biofuel-based district heating and produce their own solar power. Similarly, a youth hostel or rented cottage can have a big climate footprint if they are heated with an oil-fired boiler, for example.
In addition, the occupancy rate of the establishment affects the climate impact per guest night. For example, an establishment that only has guests during the summer season, but is heated even during the winter, will have a higher energy consumption and bigger climate footprint per guest night than one with many guests all year round.
The calculation of the emissions from accommodation in the holiday trip calculator includes the climate footprint of heating, the electricity used to power the building’s always-on systems, hot water and laundry (whether it is done by the accommodation establishment itself or purchased as a service). These emissions normally account for more than half of the climate footprint of hotel establishments (Moberg et al., 2016). Important aspects that are not included are the climate footprint of the establishment’s construction and repairs, and the climate footprint of the food served.
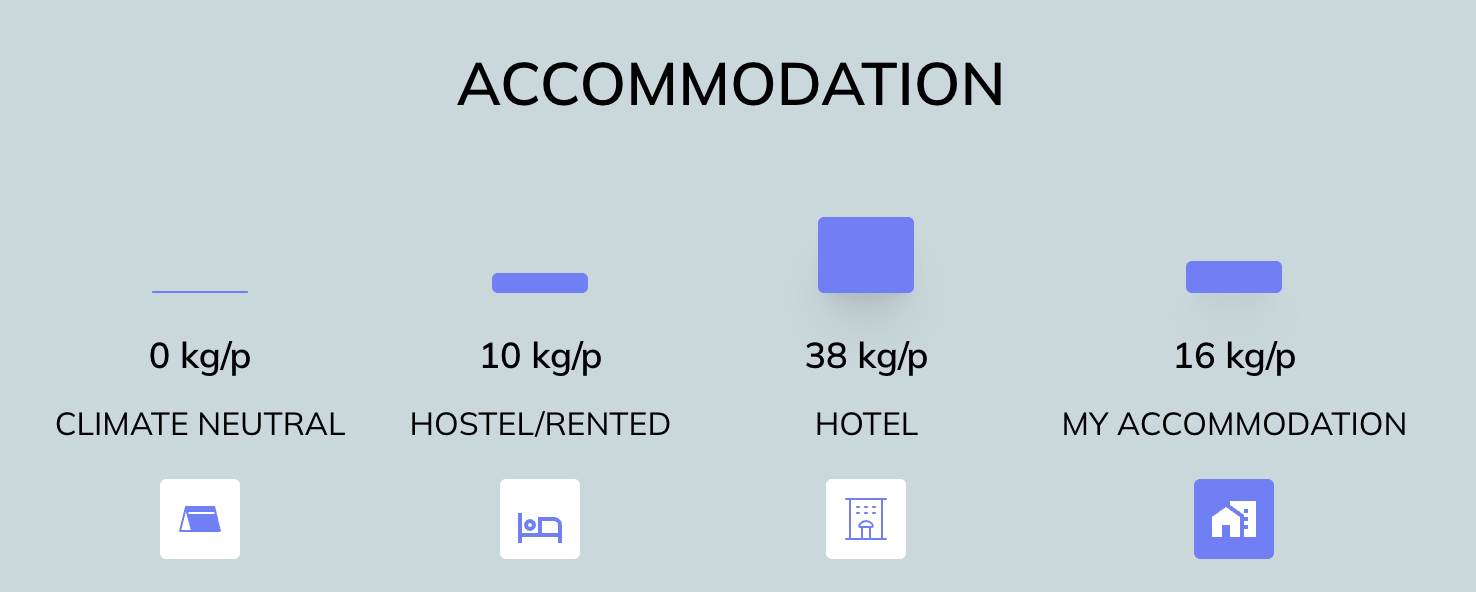
In the holiday calculator, we have chosen to include four categories of accommodation: Climate neutral, Hostel etc. and Hotel as well as Known value, (see Figure 3). Hostel can also include low carbon hotels or basic hotels, as well as various forms of renting or sharing for apartments, etc.
Figure 3 Different types of accommodation in the holiday trip calculator.
The figures for the climate footprint from hotels in different countries are based on self-reported and harmonised data from hotels around the world. These are compiled by an organisation called Greenview in what is known as the Cornell Hotel Sustainability Benchmarking Index. The index is reported to be the largest compilation for the global hotel industry, covering data from 25,000 hotels in 64 countries. We collected emissions data from the countries in which Swedish residents primarily spend their holidays (Vagabond, 2017). The differences between countries are due to the amount of energy used for heating and air-conditioning for example, and the types of energy used for heat and electricity production.
However, it is important to emphasise that the figures have a high level of uncertainty. Table 4 shows the emissions per guest night in each country. The numbers are from Greenview and collected at www.hotelfootprints.org. Since it is the emissions per guest night that are interesting in this context, we have assumed that the hotel rooms on average are occupied by 1.5 people and therefore we have divided by 1.5. This assumption is based on our estimate that about half of the rooms are used by single guests, typically business travellers, and about half are used by couples, typically holiday travellers.
The figures for hotels refers to 4 star hotels. The difference in the climate footprint between Hotel and Hostel etc. is based on a study from Switzerland which showed that “tourist homes and youth hostels” had on average a 75% lower climate footprint per guest night than was the case for hotels (Cheng et al., 2020). Our calculations are based on the broad assumption that this relationship applies in all countries.
The last category, Climate neutral., includes accommodation with family or friends, renting a room via Airbnb for example, accommodation in a camper/caravan, tent, night train or ferry cabin. The additional climate impact from this accommodation category is negligible and is therefore assumed to be 0 kg per guest night. The user can also enter a Known value for the accommodation if they know how many kg of CO2 emissions the accommodation causes per guest night.
Table 4. Kg CO2 per guest night in various countries.
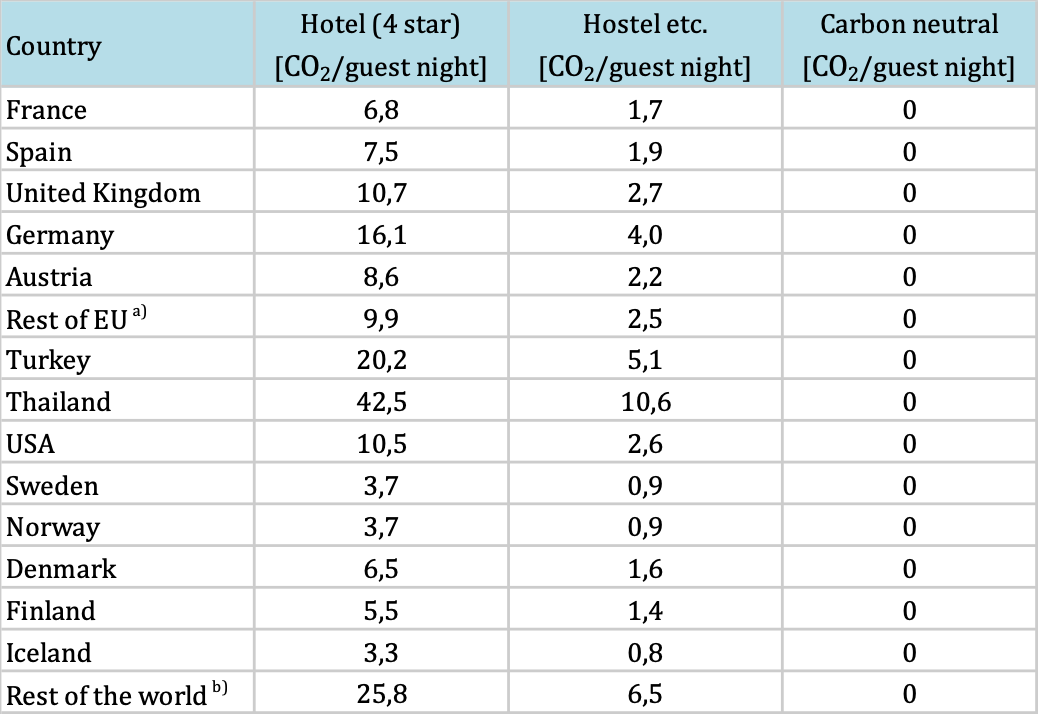
a) Rest of the EU is an average of the EU countries on the rows above.
b) Based on data for Denmark (specific figures for the rest of the Nordic countries are not available).
c) Based on Mexico, China, and Australia.
5 Thermometer
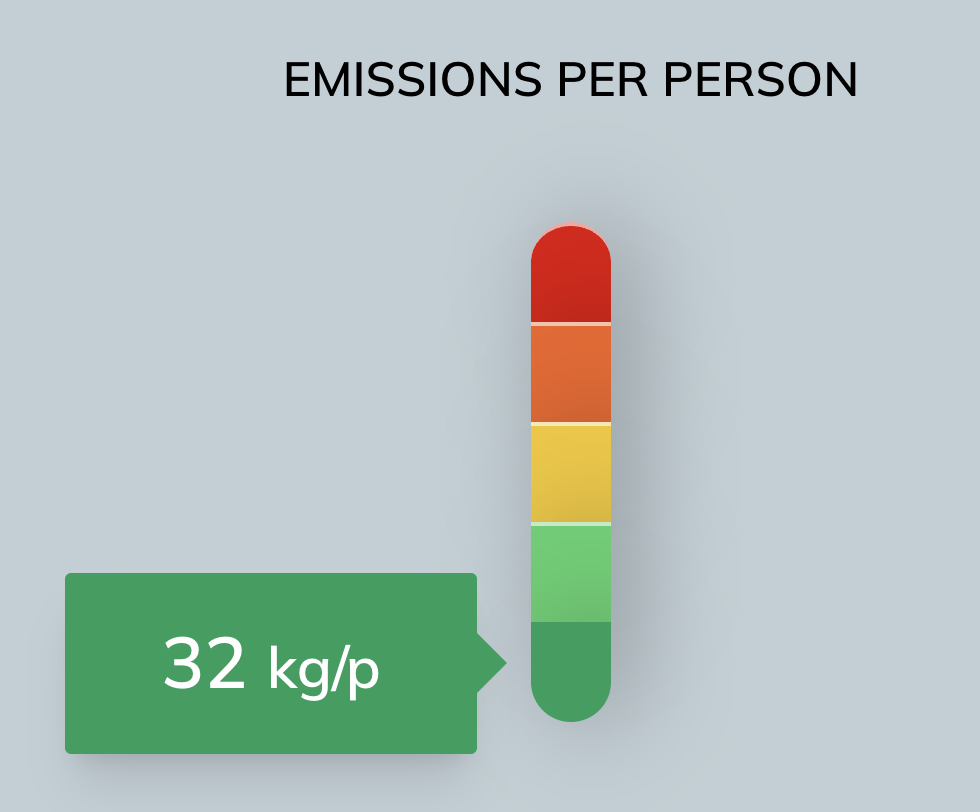
When the user has compared different modes of transport and accommodation for the selected destination, they select their preferred options in step 1. It is hoped that the user will choose more low carbon options. For many destinations, however, one can conclude that there are no low carbon transport options. It is therefore interesting to compare different holiday options, and even different destinations as well, and not just different modes of transport and accommodation choices. For this reason, the user is presented with a relative comparison of how their holiday compares to other holidays, and this is in the form of a thermometer (see Figure 4). The colour range goes from dark red for the holidays that have the highest emissions to dark green for the holidays that have the lowest emissions, accommodation and transport included.
Figure 4 Thermometer showing the user a relative comparison of their holiday with others. The holidays that have the highest emissions are dark red and the holidays that have the lowest emissions are dark green, accommodation and transport included.
The comparative framework used is the climate footprint of common holidays taken by Swedish residents. The categorisation is based on common holidays identified by Kamb (2015). Kamb identified these common holidays from a long-distance travel data set from the Swedish National Travel Survey conducted by the government agency Transport Analysis. The survey is based on telephone interviews where the respondents give an account of their holidays. Kamb identified the trips that were at least three days long and had as their main purpose holidays or family and friends. These trips were then scaled up to represent Sweden’s population.
The climate footprint for these common holidays was then calculated using the holiday trip calculator described in this report. For all trips abroad, we have assumed that an average hotel in the country was used for accommodation. For travel within Sweden, we assumed that many people stay with family and friends, therefore accommodation with a smaller climate footprint is assumed in the calculation for an average of hotels and staying at the home of someone else.
The results and categorisation from dark red to dark green can be seen in Table 5. Dark-red holidays emit over 1000 kg CO2e for travel and accommodation in total. Furthermore, light red holidays emit 500–1000 kg CO2e, yellow 200–500 kg CO2e, light green 100–200 kg CO2e, and dark green below 100 kg CO2e per holiday. Based on this categorisation, dark-red holidays are typically to destinations on another continent which requires long-haul air travel, and light-red holidays are typically to destinations within and close countries in Europe by air.
Table 5 Climate impact from various vacation options. Unless otherwise stated, it covers travel from Stockholm, Sweden. Includes accommodation in a hotel for one week.
|
kg CO2e |
Transport emissions |
Hotel emissions |
Total emissions |
|
|
>1000 |
Flight to Thailand |
1879 |
158 |
2037 |
|
Flight to New York |
1 479 |
99 |
1578 |
|
|
Charter flight to Cap Verde |
1270 |
203 |
1 473 |
|
|
500-1000 |
Charter flight to Canary Islands |
926 |
52 |
978 |
|
Flight to Rome |
476 |
52 |
528 |
|
|
200-500 |
Flight Gothenburg - Umeå |
188 |
42 |
230 |
|
Ferry to neighboring country |
342 |
42 |
385 |
|
|
100-200 |
Bus to the Netherlands |
74 |
52 |
127 |
|
Fossil car, 1000 km |
74 |
42 |
116 |
|
|
Train to french mediterranean coast |
74 |
34 |
108 |
|
|
Electric car in Scandinavia, 1000km |
18 |
52 |
70 |
|
|
<100 |
Bus, 1000 km |
32 |
52 |
85 |
|
Train in Scandinavia, 1000 km |
4 |
52 |
56 |
5.1 Consequences and comparisons of holiday emissions
Since it is not so easy to understand what the emission figures for a vacation mean in a broader context, we have chosen to illustrate them in three different ways. First, by putting the results in relation to the average annual flight emissions of a world citizen, then recalculating the emissions into how many miles of car driving it corresponds to, and finally a description of the consequences of the emissions for ice melting in the Arctic.
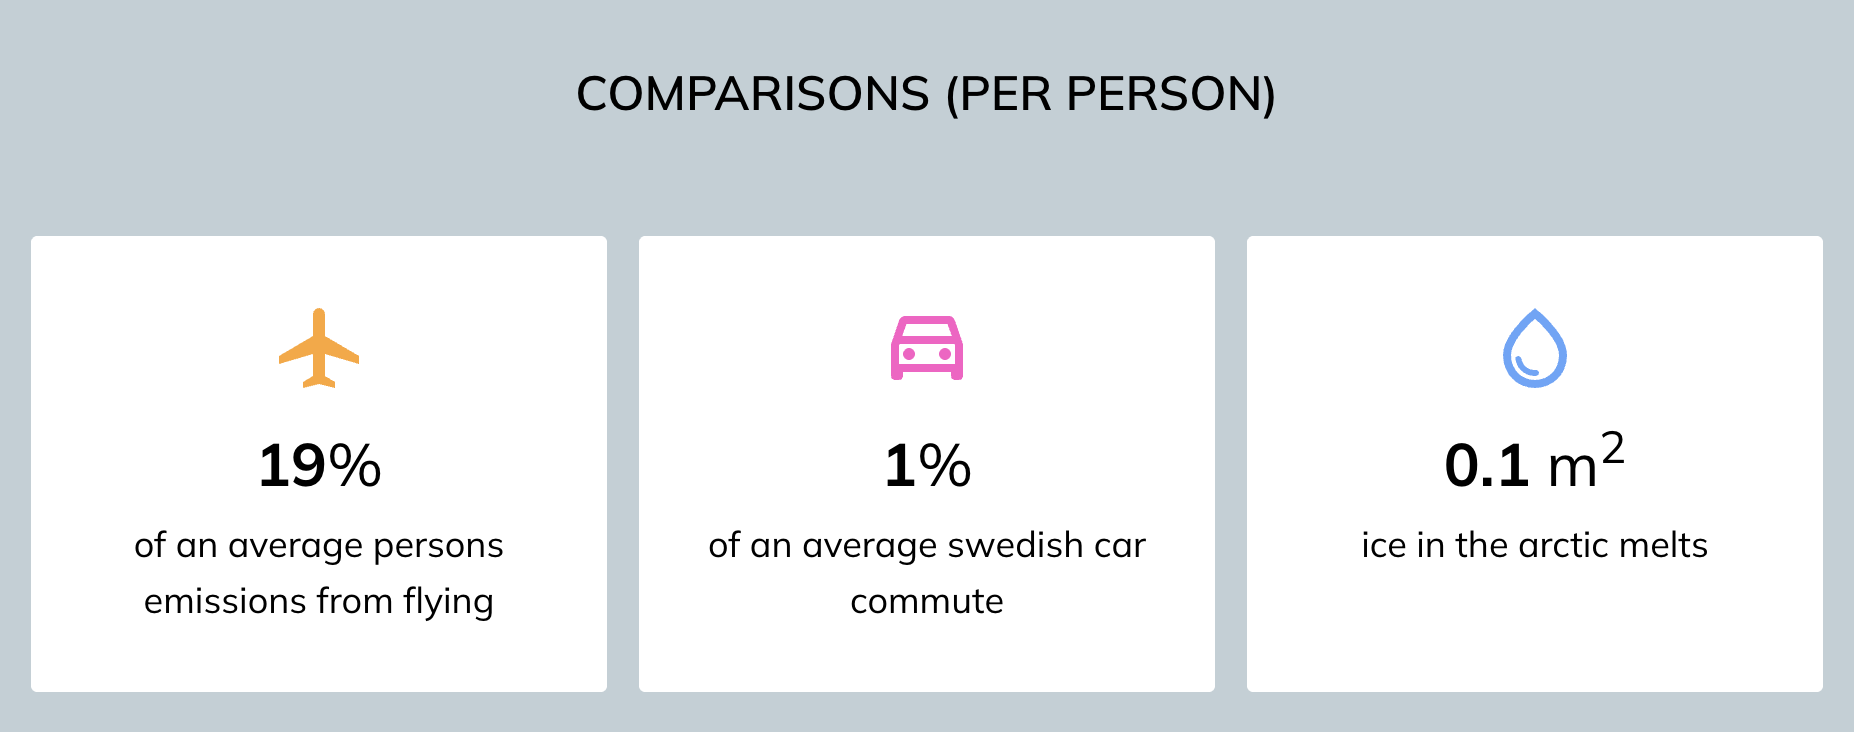
Figure 5 Illustration of comparisons. Based on a search for a return trip for four people from Stockholm to Berlin, including public transport and hostel accommodation.
19% of the average annual flight emissions of a world citizen
The global carbon dioxide emissions from aviation in 2022 were approximately 800 Mt[19], and in addition, the high-altitude effect occurs (see the flight section above). When this total climate impact is divided by the number of people in the entire world, the figure is 170 kg CO2e/person per year.
1% of an average Swedish car commute
The calculation is based on emissions of 221 grams of CO2 per vehicle kilometer for a medium-sized diesel car (see section 3.1).
0.1 m2 of the ice sheet in the Arctic melts
It is difficult to grasp what the effects of one's own emissions on the climate are. Researchers have analysed how carbon dioxide emissions affect the melting of the Arctic ice sheet. The analysis is based on calculations of the size of the ice sheet in September each year, and the aggregated carbon dioxide emissions at the same point in time. This allows you to calculate that every tonne of carbon dioxide emissions will reduce the size of the ice sheet by 3 m2 (± 0,3m2). Since the calculations of the ice that would melt vary, we have used here a robust linear relationship between the average area of the ice sheet in September, which is when it is at its smallest during the year, and the cumulative CO2 emissions. Thus, with observed values we can predict what this means for the trend in the Arctic ice sheet size during the summer. Based on this linear relationship, the Arctic ice sheet in September will disappear entirely if we emit an additional 1000 billion tonnes of CO2 (Notz & Stroeve, 2016).
6 References
Amizadeh, F., Alonso, G., Benito, A., & Morales-Alonso, G. (2016). Analysis of the recent evolution of commercial air traffic CO2 emissions and fleet utilization in the six largest national markets of the European Union. Journal of Air Transport Management, 55, 9-19.
Azar, C., & Johansson, D. (2012). Valuing the non-CO2 climate impacts of aviation. Climatic Change, 111(3), 559-579. https://doi.org/10.1007/s10584-011-0168-8
Bengtsson, S., Andersson, K., & Fridell, E. (2011). A comparative life cycle assessment of marine fuels: liquefied natural gas and three other fossil fuels. Proceedings of the Institution of Mechanical Engineers, Part M: Journal of Engineering for the Maritime Environment, 225(2), 97-110.
Bofinger, H., & Strand, J. (2013). Calculating the carbon footprint from different classes of air travel. The World Bank.
Boucher, O., Randall, D., Artaxo, P., Bretherton, C., Feingold, G., Forster, P., Kerminen, V. M., Kondo, Y., Liao, H., & Lohmann, U. (2013). Clouds and aerosols. In Climate change 2013: the physical science basis. Contribution of Working Group I to the Fifth Assessment Report of the Intergovernmental Panel on Climate Change (pp. 571-657). Cambridge University Press.
Bundesnetzagentur. (2019). Railway Market Analysis. Germany 2019.
Cheng, M., Chen, G., Wiedmann, T., Hadjikakou, M., Xu, L., & Wang, Y. (2020). The sharing economy and sustainability–assessing Airbnb’s direct, indirect and induced carbon footprint in Sydney. Journal of Sustainable Tourism, 28(8), 1083-1099.
Energimyndigheten. (2023). Drivmedel 2022. Resultat och analys av rapportering enligt regelverken för hållbarhetskriterier, reduktionsplikt och drivmedelslag. ER 2023:19 (ER 2023:19).
Energimyndigheten. (2026). Statistik om biobränslen och drivmedel. https://www.energimyndigheten.se/statistik/ovrig-energistatistik/statistik-om-biobranslen-och-drivmedel/
Eurostat. (2017). File:Table 2 Percentage of railcars by type of source of power, by country.png. Retrieved 20 mars 2018 from http://ec.europa.eu/eurostat/statistics-explained/index.php/File:Table_2_Percentage_of_railcars_by_type_of_source_of_power,_by_country.png
Fichter, C., Marquart, S., Sausen, R., & Lee, D. S. (2005). The impact of cruise altitude on contrails and related radiative forcing. Meteorologische Zeitschrift, 14(4), 563-572.
Fuglestvedt, J. S., Shine, K. P., Berntsen, T., Cook, J., Lee, D. S., Stenke, A., Skeie, R. B., Velders, G. J. M., & Waitz, I. A. (2010). Transport impacts on atmosphere and climate: Metrics. Atmospheric Environment, 44(37), 4648-4677.
Gode, J., Byman, K., Persson, A., & Trygg, L. (2009). Miljövärdering av el ur systemsynpunkt https://www.ivl.se/download/18.343dc99d14e8bb0f58b759f/1445517418744/B1882.pdf%20h%C3%A4mtad%2021-02-2020.
Gössling, S., Peeters, P., Ceron, J.-P., Dubois, G., Patterson, T., & Richardson, R. B. (2005). The eco-efficiency of tourism. Ecological Economics, 54(4), 417-434.
Hammarström, U. (1999). Mätning och simulering av bilavgaser: körning med och utan husvagn i laboratorium och på väg (Vol. VTI meddelande 856). Statens väg-och transportforskningsinstitut., VTI meddelande 856.
Iannaccone, T., Landucci, G., Tugnoli, A., Salzano, E., & Cozzani, V. (2020). Sustainability of cruise ship fuel systems: Comparison among LNG and diesel technologies. Journal of Cleaner Production, 260, 121069.
ICAO. (2025). CORSIA Default Life Cycle Emissions Values for CORSIA Eligible Fuels. https://www.icao.int/sites/default/files/environmental-protection/CORSIA/Documents/CORSIA%20Eligible%20Fuels/ICAO-document-06-Default-Life-Cycle-Emissions-June-2025.pdf?utm_source=chatgpt.com
IEA. (2019). The Future of Rail - Opportunities for energy and the environment. www.iea.org
IPCC. (1999). Aviation and the global atmosphere–A special report of IPCC working groups I and III. Intergovernmental Panel on Climate Change. Cambridge University Press.
IVL. (2025). Emissionsfaktor för nordisk elmix år 2021 – 2023. https://ivl.diva-portal.org/smash/get/diva2:1998248/FULLTEXT01.pdf
Kamb, A. (2015). Sustainable Transitions: The Case of Swedish Vacation Practices (Publication Number 2015:06) Chalmers tekniska högskola]. Göteborg.
Kamb, A., Larsson, J., & Åkerman, J. (2018). Klimatpåverkan från svenska befolkningens flygresor 1990 – 2017 Chalmers. https://research.chalmers.se/en/publication/506796
Knörr, W., & Hüttermann, R. (2016). EcoPassenger. Environmental Methodology and Data. I. f. E.-u. Unweltforschung.
Kurzawska-Pietrowicz, P. (2023). Life cycle emission of selected sustainable aviation fuels–A review. Transportation Research Procedia, 75, 77-85.
Larsson, J., & Kamb , A. (2022). Methodology Report for www.travelandclimate.org Version 3.0. https://research.chalmers.se/en/publication/539336
Lee, D., Fahey, D., Skowron, A., Allen, M., Burkhardt, U., Chen, Q., Doherty, S., Freeman, S., Forster, P., & Fuglestvedt, J. (2021). The contribution of global aviation to anthropogenic climate forcing for 2000 to 2018. Atmospheric Environment, 244, 117834.
Lenner, M. (1993). Energiförbrukning och avgasemission för olika transporttyper (Vol. VTI meddelande 718 ). Statens Väg-och trafikinstitut.
Miljöförbundet Jordens Vänner. (1997). Ställ om för rättvist miljöutrymme. Hur ser ett hållbart Sverige ut?
Miyoshi, C., & Mason, K. J. (2009). The carbon emissions of selected airlines and aircraft types in three geographic markets. Journal of Air Transport Management, 15(3), 138-147.
Moberg, Å., Wranne, J., Martinsson, F., & Thornéus, J. (2016). Miljökartläggning av hotellverksamhet (Nr U 5672). I. S. Miljöinstitutet.
Morfeldt, J., & Johansson, D. J. (2022). Impacts of shared mobility on vehicle lifetimes and on the carbon footprint of electric vehicles. Nature Communications, 13(1), 6400.
Morfeldt, J., Larsson, J., Andersson, D., Johansson, D. J., Rootzén, J., Hult, C., & Karlsson, I. (2023). Emission pathways and mitigation options for achieving consumption-based climate targets in Sweden. Communications Earth & Environment, 4(1), 342.
Mowforth, M., & Munt, I. (2015). Tourism and sustainability: Development, globalisation and new tourism in the third world. Routledge.
Notz, D., & Stroeve, J. (2016). Observed Arctic sea-ice loss directly follows anthropogenic CO2 emission. Science, 354(6313), 747-750.
Paleari, S., Redondi, R., & Malighetti, P. (2010). A comparative study of airport connectivity in China, Europe and US: Which network provides the best service to passengers? Transportation Research Part E: Logistics and Transportation Review, 46(2), 198-210.
Peters, G. P., Aamaas, B., T. Lund, M., Solli, C., & Fuglestvedt, J. S. (2011). Alternative “global warming” metrics in life cycle assessment: a case study with existing transportation data. Environmental Science & Technology, 45(20), 8633-8641.
Rahn, A., Wicke, K., & Wende, G. (2022). Using Discrete-Event Simulation for a Holistic Aircraft Life Cycle Assessment. Sustainability, 14(17), 10598.
Searchinger, T. D., Wirsenius, S., Beringer, T., & Dumas, P. (2018). Assessing the efficiency of changes in land use for mitigating climate change. Nature, 564(7735), 249-253.
Sveriges Bussföretag. (2022). Växthusgasutsläpp från kommersiell busstrafik. In: https://www.transportforetagen.se/om-oss/vara-branscher/sveriges-bussforetag/branschfragor/kapitelsida/hallbarhet-och-utslapp/.
Thomas Cook Airlines. (2019). Sustainability 2018/2019. https://dk.thomascookairlines.dk/media/510b5c7e-a450-4d51-943e-0377abb51db2/cnxQGA/Website%20files%20for%20download/TCNE_INFOGRAPHIC_2018.pdf
Trafikanalys. (2017). RVU Sverige 2011–2016. Den nationella resvaneundersökningen. In. Stockholm.
TUI GROUP. (2017). Carbon & Other MEtrics Methodology and Calculations Explanatory Notes FY 2016/17.
Vagabond. (2017). Resebarometern 2017 – Turkiet och USA förlorare, Grekland vinnare. Retrieved 20 mars 2018 from http://www.vagabond.se/artiklar/artiklar/20170517/resebarometern-2017-/
Wisell, T., & Jivén, K. (2020). Verktyg för beräkning av resors klimatpåverkan. Användning, metod och beräkningsförutsättningar. Uppdaterad Version 2020.
Åkerman, J. (2012). Climate impact of international travel by Swedish residents. Journal of Transport Geography, 25, 87-93. https://doi.org/10.1016/j.jtrangeo.2012.07.011
Åkerman, J., Isaksson, C., Johansson, J., & Hedberg, L. (2007). Tvågradersmålet i sikte? Scenarier för det svenska energi- och transportsystemet till år 2050. Rapport 5754.
[1] For a detailed description of the assumptions regarding emissions from the production phase of fossil fuels, see section 2.1 in method report 3.0 Larsson, J., & Kamb , A. (2022). Methodology Report for www.travelandclimate.org Version 3.0. https://research.chalmers.se/en/publication/539336.
[2] Data for our figures regarding car size were obtained from the IVL Swedish Environmental Research Institute, which makes analyses based on the Handbook Emission Factors for Road Transport (HBEFA) model, which includes statistics for all road transport in Sweden. The figures were produced with the help of Martin Jerksjö of the IVL Swedish Environmental Research Institute. In the statistics from the Swedish Energy Agency, the term "average car" is used for each fuel type. We have assumed that this is the same as a medium-sized car. Seven-seater cars are assumed to have the same emissions as other big cars. Campers are not included in the HBEFA model. This estimate is based on the average total weight of campers (later models) taken from the motor vehicle register and on vehicles with an equivalent weight in the HBEFA model. Caravans are also not included in the HBEFA model. The difference in emissions between a medium-sized car and a car with a caravan on the one hand, and a medium-sized car and a camper on the other, is roughly the same (Hammarström, 1999).
[3] The figures were developed by Johannes Morfeldt at Chalmers University of Technology based on the model used in this article: Morfeldt, J., Larsson, J., Andersson, D., Johansson, D. J., Rootzén, J., Hult, C., & Karlsson, I. (2023). Emission pathways and mitigation options for achieving consumption-based climate targets in Sweden. Communications Earth & Environment, 4(1), 342. . These production emissions are evenly distributed over the entire driving distance of the car, which is assumed to be a total of 216,000 km over a lifespan of 17 years: Morfeldt, J., & Johansson, D. J. (2022). Impacts of shared mobility on vehicle lifetimes and on the carbon footprint of electric vehicles. Nature Communications, 13(1), 6400.
[4] Based on SJ’s average for its entire train fleet and with average occupancy. However, many holiday trips in Sweden and abroad are made in high-speed trains with high occupancy rates. For the X2000, SJ reports a lower energy consumption (56 Wh/pkm). For trains in Europe, the energy consumption data states from 38 to 52 Wh/pkm (Source: Project FINE1, page 19). On the other hand, some holiday trips are made in night trains and these have a higher energy consumption per passenger because there are roughly half the number of places per carriage (Source: European Parliament, page 25). We estimate that the figure of 70 Wh reflects well a reasonable average for holiday trips. It is also close to a figure for the European average of 87 Wh (Knörr and Hüttermann, 2016).
[5] There are two longer stretches of railway line in northern and eastern Norway that are not electrified (Source: Wikipedia).
[6] Emissions from electricity production in Russia are roughly as high as those in the EU. In 2020, they were 316 gCO2/kWh (Sources: Climate transparency, Wikipedia).
[7] The calculation is: (325*10*0,26)/28=21. The numbers is based on 325 gCO2e/kWh diesel for 2024 with reduced reduction obligation, 10 kWh/litre, 0.26 litres per km, 28 people on the bus.
[8] This information has been obtained through personal communications with Dani Lindberg at Viking Line and Dinis Oliveira at Stena Line.
[9] Prices have been obtained for five different ferry lines which links Sweden with Denmark, Germany, and Poland. Prices have been obtained for a trip during the low season (March) and one during the high season (July). It is assumed that there are three people per car on average.
[10] See page 21 of Wisell and Jivén, 2020. However, the figures themselves are not in the report, but in an Excel file "calculation tool for transport emissions" which is available on the Swedish Environmental Protection Agency website.
[11] This does not include cars accompanying passengers on ferries. To include a car, according to their results, you need to add approximately 500 gCO2/km.
[12] In 1993, Lenner arrived at 200 gCO2/pkm, and in 2012 Åkerman estimated 170 grams.
[13] Nynäshamn – Visby 6.3 kg CO2. Source: Destination Gotland.
[14] Two sources (www.nltg.com and www.jet2plc.com) specify 68 g CO2/pkm for 2022, but this refers to per km of actual distance travelled, i.e., including holding patterns due to congestion in the airspace around airports, for example. The actual distance travelled by the flight is therefore longer than the great-circle distance and the emission factor is thus lower in this case than if the great-circle distance had been used. Since we have used the great-circle distance in other emission factors, we have adjusted the figure up by 3% to 69 gCO2/pkm so it can be compared with other emission factors. Here, too, it has been assumed that the rate of reduction has continued at the historical rate of 1.5% per year, as well as markups for non-CO2 effects and emissions from the extraction/refining of the fuel.
[15] Review of a number of aircraft models on Seatguru for the following airlines: Norwegian Air Shuttle, SAS, KLM, Swiss, Austrian, Brussels Airlines, United, American Airlines, Lufthansa and Thomas Cook Airlines.
[16] Greenhouse gas emissions other than CO2 also result from other modes of transport, but these effects are on average considerably smaller than for aviation and therefore do not significantly affect the model Peters, G. P., Aamaas, B., T. Lund, M., Solli, C., & Fuglestvedt, J. S. (2011). Alternative “global warming” metrics in life cycle assessment: a case study with existing transportation data. Environmental Science & Technology, 45(20), 8633-8641. .
[18] The figures in the ICAO carbon emissions calculator for long-haul flights are very low, around 50 gCO2/pkm. However, in principle, the non-CO2 effects are greater on long-haul flights, which means that the overall climate impact is about the same as for average flights.